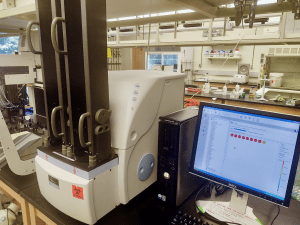
The UCSC CSC offers two nearly identical EnVision plate readers.
Basic information:
- Make/Model: Perkin Elmer EnVision HTS Multilabel Readers
- What makes it special compared to other plate readers: fast, high end
- Capabilities in brief: Both instruments have absorption, fluorescence, ultrasensitive luminescence, and fluorescence polarization modes. The newer instrument also has time-resolved fluorescence detection and a laser for alpha screen. Filter-based wavelength separation; filter sets are easily swapped out for customization. See below for more detailed specifications.
- For high throughput: both have stackers for automated plate loading. For convenience, we have two pairs of stackers of different heights to choose from.
Here you can read a general background introduction about plate readers for users who are new to using plate readers.
- Plate readers measure samples in microtiter plates. Ours can take anything between 1 and 1,536 well plates.
- Plate readers are a type of photometer; they measure photons.
- They separate colors using filters or monochromators (or a hybrid) – the CSC has filter-based instruments, and we chose this because they are faster for high throughput applications.
- Ours are multimode plate readers that can do all of the following:
- absorbance gives the concentration of a molecule of interest according to the Beer-Lambert law: A=εCl=log(I0/I). This uses transmitted light so you must use clear bottom plates and if they are sealed then they need the seal to be as clear as possible.
- luminescence is the result of a chemical reaction, for example, when firefly luciferase converts luciferin to oxyluciferin. A solid white plate will help give the highest signal, but use a clear bottom if you must also do microscopy. The image below shows how an aperture placed in the lightpath is used in luminescence – click to see large size.
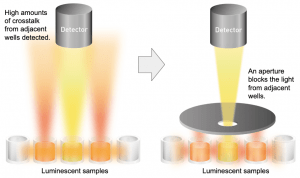 (figure adapted from BMG Labtech)
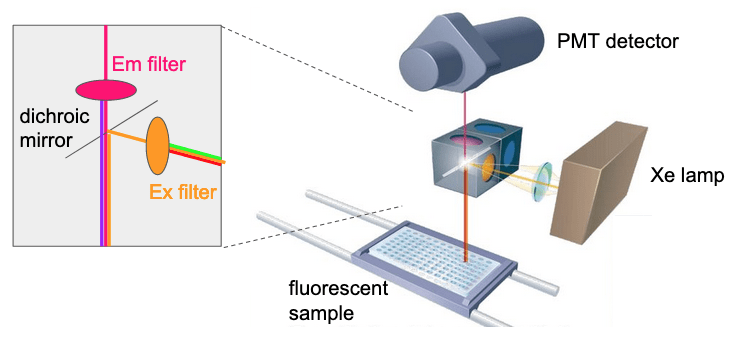
- fluorescence occurs when an electron of an atom is excited by light, and as it returns to the ground state, a photon is emitted. A solid black plate will help give the least background, but use a clear bottom if you must also do microscopy. In the plate reader, for top read, the delivered excitation and measured emission light beams are in opposite directions and dichroic mirrors separate the light, as shown in the figure below – click to see large size.
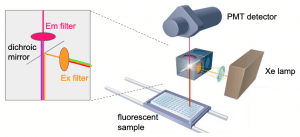 (figure adapted from BioTek)
- time-resolved fluorescence uses time gating to specify a detection time interval after a flash of excitation light, to improve the signal-to-noise ratio. This is especially useful in Förster Resonance Energy Transfer (FRET), which measures the distance (~5 nm) between two fluorophores. Lanthanide dyes are especially good for this type of measurement because of their unusually long lifetimes.
- alpha screen relies on a chain of events that allows one to measure the proximity (~200nm) of two molecules, with excitation light that is of a longer wavelength than the emission light, thereby greatly reducing background to create extremely sensitive assays. See this PDF from Perkin Elmer describing alpha screen technology.
- fluorescence polarization uses plane polarized light to measure the tumbling motion of the fluorescent molecule, which is inversely related to its size. It can therefore be used to measure binding events, because a small molecule will decrease in mobility when bound to a large molecule.
- Check out a presentation on F-Pol, TR-FRET and alpha screen by Beverley of the CSC for the Rubin lab meeting May 2022.


Manufacturer's documentation:
- Perkin Elmer sales brochure with capabilities, light path, alpha overview, etc (8 pages PDF).
- Detailed product specifications on the Perkin Elmer website.
Interface: Both our EnVisions are operated by controller PCs, with (Wallac) EnVision Manager software.
Stacker and barcodes: Both EnVisions have stackers for high throughput. We have two 20-plate and two 50-plate magazines that can be used interchangeably. 50 plates can therefore be read walk-away, and they can be programmed to be restacked, reread, etc. Both EnVisions have barcode readers to verify the identity of each plate. Note that the stacker on the EnVision CANNOT do delidding.
Shaker: Both EnVisions have an internal shaker with linear, orbital, and double orbital shaking modes and a range of possible shake frequencies and travel distances.
Temperature: The newer EnVision's internal heater can increase to room temp plus +2 (i.e. around 26 °C) to +45 (=69 °C) for live cells and enzyme kinetics.
Apertures: For luminescence, we have two 96-format apertures, three 384-format apertures (which are also capable of being used for 96-well microplates, and are the default loaded on our machines), one 1536-format aperture, and one 1536-format low volume microplate aperture.
Mirrors and filters inventory: click here for a growing list.
Light sources: both EnVisions have a Xenon flash lamp. The newer EnVision also has a 680nm alpha laser.
Detectors: both EnVisions have top and bottom read general-purpose detectors as well as a top read ultrasensitive luminescence detector with dedicated PMT (40x more sensitive than the general detector). For fluorescence, we have dual read capabilities with two simultaneous detectors. Detection can be done with one measurement per well or a finely resolved scan in the X direction. Kinetic measurements and time-courses are programmable.

We do not currently offer:
- dynamic or static light scattering
- cooling
- heating high enough to denature proteins or melt hybridized nucleic acids
the following that are optional packages could be acquired with your contribution: - filters for luminescence. If you have multiple colored luminescence substrates, we suggest you add and measure them sequentially.
- on-board dispensing. If you need to add reagents before or between measurements, we suggest you do so using our separate dispensers, robots, or a multichannel pipet.
- heating for more than one microplate at a time. For applications that you might have run multiple plates heated over a time course (e.g. a bacterial growth curve), we suggest one of the following solutions:
-
- Run the screen at room temp
- Run one plate at a time from start to finish
- Transfer stacks of plates manually between the plate reader and a separate incubator, such as those attached to our robotic workstations
- Do an endpoint assay
You will get the best quality data if you select the correct microplate for your assay. Here are some considerations:
- Is this an endpoint assay or are you doing cell growth under sterile conditions? Is it with adherent cells that need a specific coating? Will the cells need to adhere through washing steps?
- Is evaporation over time an issue? What about gas exchange (e.g. for live cells, they need O2 and CO2)? While inside the plate reader, plates will be de-lidded, but can have a clear seal or a translucent breathable seal applied. During sample prep, the plates can have a regular lid, a vented lid (for live cells), or no lid.
- Are your reagents precious, such that a smaller volume is better, or do you prefer the ease of pipetting into a larger well? Will there be a lot of assay conditions, controls, and replicates to compare (all on one plate)?
- Will there be mixing in the well? Circular wells mix more evenly. But if you are planning on imaging the samples with a microscope then square wells may be better, especially if you want to image the entire well (low magnification or tiling).
- What measurement technology are you using?
- Absorbance - MUST have a clear bottom. Note that the clear bottom should be clear specifically in the UV range (e.g. Greiner UV-Star brand plates) if you are doing absorbance below 400nm.
image credit: gbo.com
Walls can be clear or black but ideally not white. Bottom must be flat. - Luminescence - Plates CANNOT be clear because of crosstalk between wells. White plates are ideal for best signal. If you want to see your sample under a microscope, then have a clear bottom but otherwise solid white is best. Bottom can be flat or round.
- Fluorescence - Plates must be black to reduce background, and usually solid black is best, and can be flat or round bottom. But if you are doing bottom read (i.e. camera gets light from the bottom of the sample, not the top), or want to see the sample under a microscope, then have a clear flat bottom.
- Absorbance - MUST have a clear bottom. Note that the clear bottom should be clear specifically in the UV range (e.g. Greiner UV-Star brand plates) if you are doing absorbance below 400nm.
Videos:
» VIDEO! a brief introductory training on our plate reader selfie-style by Beverley in the CSC.
» VIDEO! of our plate reader software virtual group training with Bill Ortiz from Perkin Elmer on February 17, 2022.
Protocols:
- Mammalian cell viability drug screen by Cell Titer Glo in 384 well format
- Cell Titer Glo kit manual
- Cell Titer Glo in 1536 format protocol from BioTek
Manuals:
- 2019 Perkin Elmer official user manual (232 pages PDF)
- 2019 Perkin Elmer official instrument manual (116 pages PDF)
Educational resources:
- Slides for a presentation on TR-FRET and alpha screen by Beverley of the CSC for the Rubin lab meeting May 2022.
- Detailed description of HTRF by Perkin Elmer (48 pages PDF)
- Descriptions of alpha technology on this website and this 8 page PDF from Perkin Elmer.
Other resources
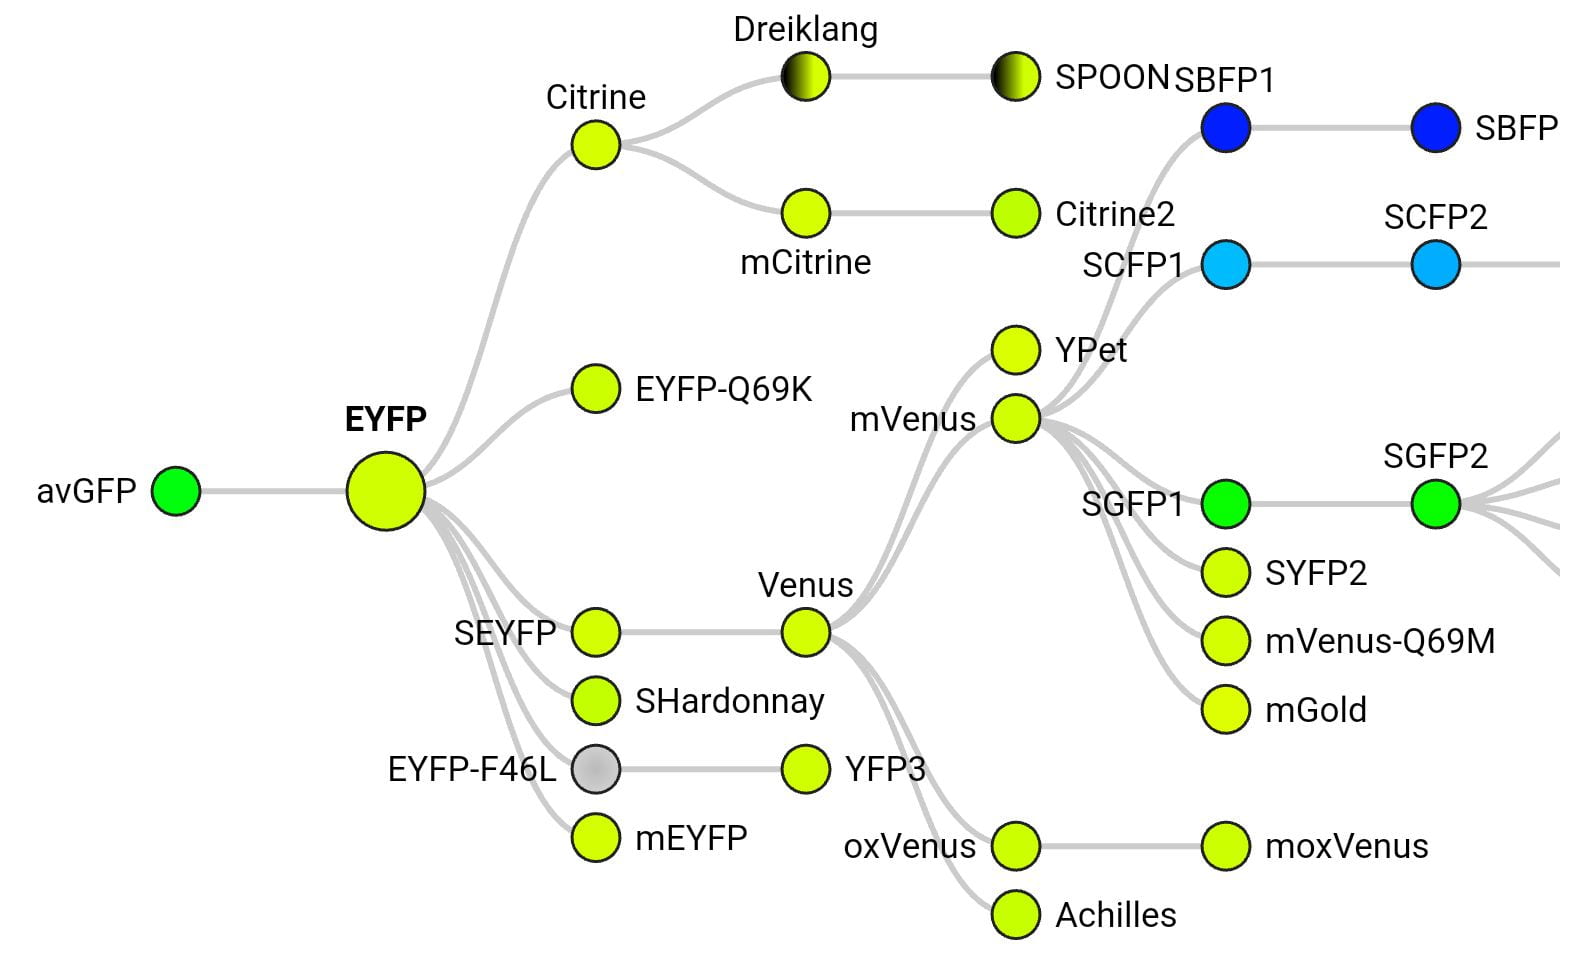
- Thermo’s SpectraViewer is a great tool for looking at one or more fluorophores and how they perform with different excitation and emission wavelengths.
- FP Base database of fluorescent proteins. It includes a diagram showing the origins of each fluorescent protein colored by emission wavelength (example below for eYFP), including relatively obscure FPs, and useful information for each variant such as the time they take to fold after translation, whether they’re a monomer, and pKa.